
Google Trends is a free tool from Google that lets you measure Google search interest in any keyword over time. The data is based on a random sample of aggregated, anonymized, and categorized Google and YouTube searches extending back to 2004 across all regions of the world.
This article serves as a general guide for beginners. For specific use cases, skip to the articles below:
Getting Started
To start tracking Google Search Trends, enter a keyword like "sunscreen" in Google Trends Explore.
Note that when you type sunscreen, you'll have the option to select sunscreen as either a "Search term" or a "Topic." Stick with Search Terms for now (what's the difference?).

Insights from the "Interest over time" graph
Google Trends’ primary section, Interest over time, displays a graph of search interest in sunscreen. The Y-axis uses a normalized scale of 0 to 100, where 100 represents the peak popularity of the search term during that period, 50 represents half that interest, and 0 indicates insufficient data.
Note that this is not absolute search volume, only the relative level of interest (what's the difference?).
The X-axis represents time, which is set to 12 months by default. However, you can change it in the dropdown to view interest over a longer or shorter period, going as far back as 2004 (which highlights consistent growth in the past 5+ years)...

Or as recently as the past hour.

A long-term view is useful if you're forming an estimate of sunscreen’s future growth potential, which could be used for everything from product research to investing. On the other hand, real-time insights are crucial for any time-sensitive task, such as news SEO.
You can use 5 years as a middle ground to pull some key insights.

From this graph, you can see:
Interest consistently peaks in summer, showing clear seasonality: May-June sees the highest interest in sunscreen each year, which is likely when you would want to launch a sunscreen-related product or piece of content. For more on these use cases, see these eCommerce and SEO guides.
Interest falls dramatically during winter: Searches hit a low of 50 this past December, or 50% of the following peak in June.
Overall interest is rising: Over the past 5 years, both peak and baseline interest levels have increased. In 2020, the peak interest reached 47, while in 2024 it hit 100. Additionally, during the winter of 2019, interest dropped to the mid-teens, whereas in winter 2023, it never fell below 45. This means that even at the lowest point in 2023, interest in sunscreen was nearly as high as the peak of 2020.
While Google Trends provides these general insights, Glimpse, a Chrome extension that enhances Google Trends, adds the absolute search volume, growth rate, and a trendline.

Additionally, a dedicated seasonality panel provides a simple visualization of sunscreen’s seasonality, along with an explanation for what drives it.

While the focus of this guide is on Google Trends, we’ll reference Glimpse where relevant to highlight additional insights.
Lastly, you can filter interest to a specific location, such as country, region, or even city. This is an important step if you're interested in a particular market, as worldwide and regional data can differ.
Australia, for instance, follows the opposite seasonality of sunscreen interest due to its position in the southern hemisphere. You could use this insight to create and time the launch of region-specific content.

Declining trend
While some search terms, like sunscreen, are on the rise, others have passed their prime. Keto is one such example. Viewing the past 10 years of interest within Google Trends tells the story of its rise and fall.

This graph reveals a number of key insights:
Post-peak decline: After a steady climb over two years, interest surged dramatically at the end of 2018 to an all-time high, which may never be surpassed.
Strong seasonality
New Year’s spike: Each year, New Year’s resolutions drive a noticeable spike in interest during January, followed by a sharp decline soon after.
Summer motivation: The annual decline is briefly slowed by the summer months, as people seek to get in shape for the beach, look better for weddings (the majority of which happen during summer), and generally wear fewer clothes.
Holiday laxity: Giving way to the holiday spirit of pleasure and self-indulgence, interest resumes its fall towards the end of the year. Again, you can use the Glimpse extension to more easily visualize these variations and understand the reasons behind them using the Seasonality panel.
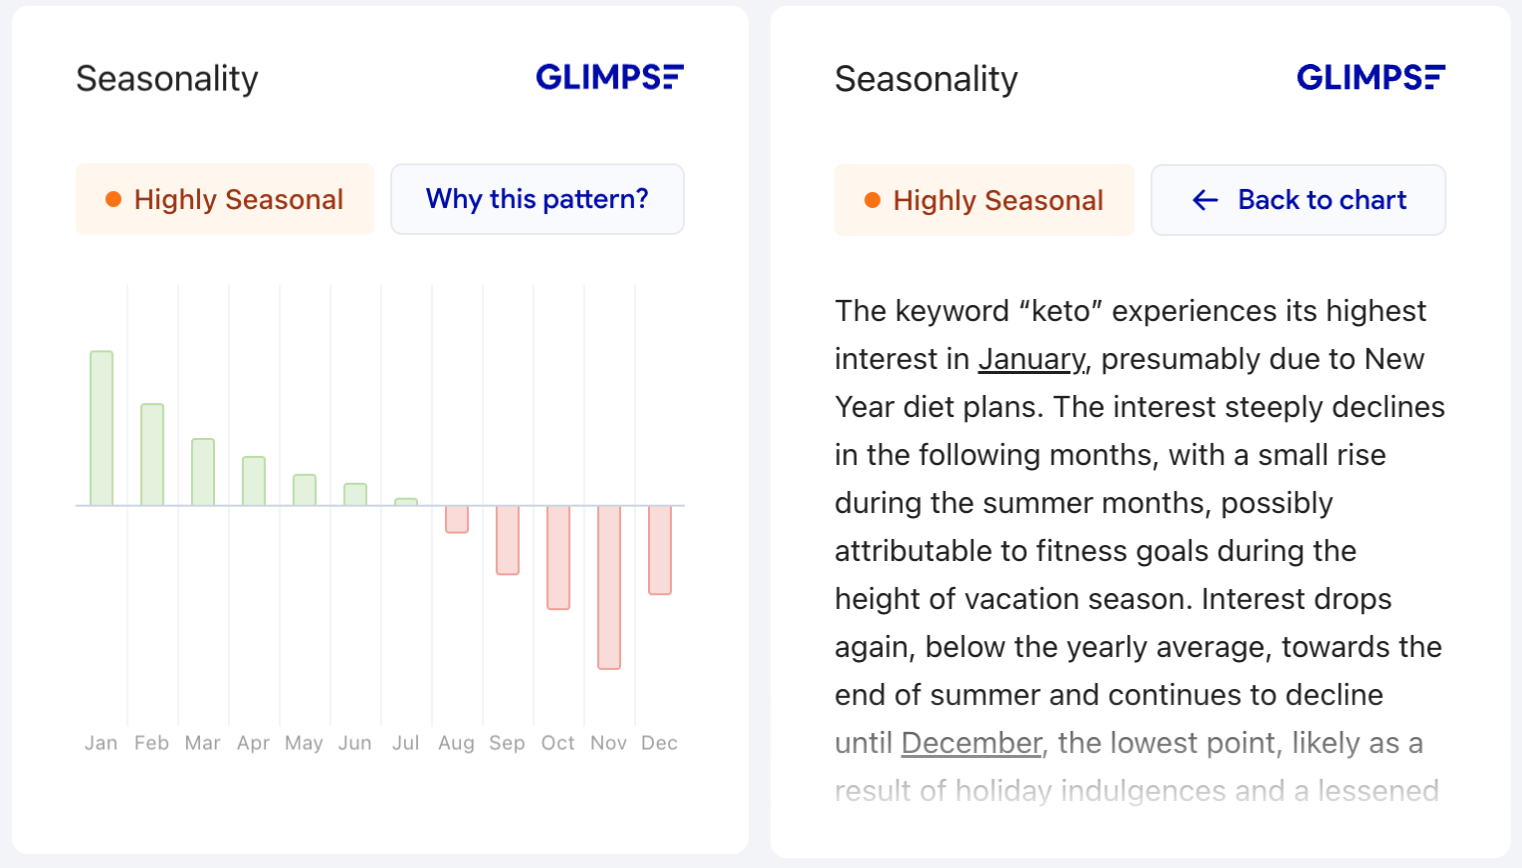
COVID collapse: Like many other non-essential trends, keto experienced a sharp drop in interest in March 2020, though it rebounded within a few months.

Fad
Other graphs reveal the story of an overnight media sensation that couldn’t sustain its momentum. Marie Kondo’s ‘KonMari Method’ is one such example.

Despite experiencing a massive spike after years of moderate interest, the ‘KonMari Method’ became a one-hit wonder—a fate that often befalls many seemingly revolutionary products, services, and brands.
Note on seasonality
While many search trends exhibit seasonality on an annual basis, others show monthly or even weekly patterns. For instance, searches for “pay rent” consistently peak on the 1st of every month.

While interest in “ice cream” peaks during the weekends.

Make sure to both lengthen and shorten time ranges to spot all types of seasonality.
Region-specific insights with "Interest by Region"
In addition to interest over time, you can view which regions are most interested in a keyword with the Interest by region section.
Results for sunscreen show that the top-ranking regions worldwide are Indonesia, Nepal, Cambodia, Malaysia, and Singapore at 100, 83, 63, 57, and 54, respectively.

It’s important to clarify that this ranking doesn’t reflect the total number of searches for sunscreen. If it did, the most populous regions would always come out on top. Instead, the ranking is based on the percentage of sunscreen-related searches relative to all searches in a given region.
For instance, Ireland, with a population of just 5 million, scores 100 for interest in “whiskey.” Meanwhile, the United States, with 330 million people (66 times larger than Ireland), scores only 63.

If you do want to see which regions perform the most searches for sunscreen, rather than which are most interested on a relative scale, then you can refer to the absolute panel of Interest by Region within Glimpse, which shows a very different list:

In eCommerce, this information could help us form targeted marketing campaigns or product launches, while in keyword research it could inspire content tailored to a specific location.
Gauge keywords against each other with "Compare"
In addition to viewing an individual keyword’s interest over time and by region, you can compare keywords against each other.
For instance, let's add “coat” as a comparison in the Compare search bar.
The Interest over time graph now shows search interest for each term overlaid on the same time series graph. In this example, searches for coats (in red) show the opposite seasonality to sunscreen (in blue), which is expected. Despite coats having more consistent interest overall, sunscreen has briefly surpassed it in the last two years.

This relative comparison is the closest thing Google Trends offers to absolute search volume, and is useful in a number of contexts.
First, in SEO, you can use it to find the higher-volume keyword variation and capture more traffic by including it in your content.
Next, in product research, you can compare products to find the most profitable and ride a wave of demand.
Finally, in investing, you can compare competitors to gauge market share or consumer sentiment and inform investment decisions.
Learn more about comparing terms.
Compare regions
In addition to comparing keywords’ interest over time, you can compare their Interest by region.
After adding two or more terms, this section displays the top regions sorted by the percentage of the combined search volume that is attributed to the primary term.
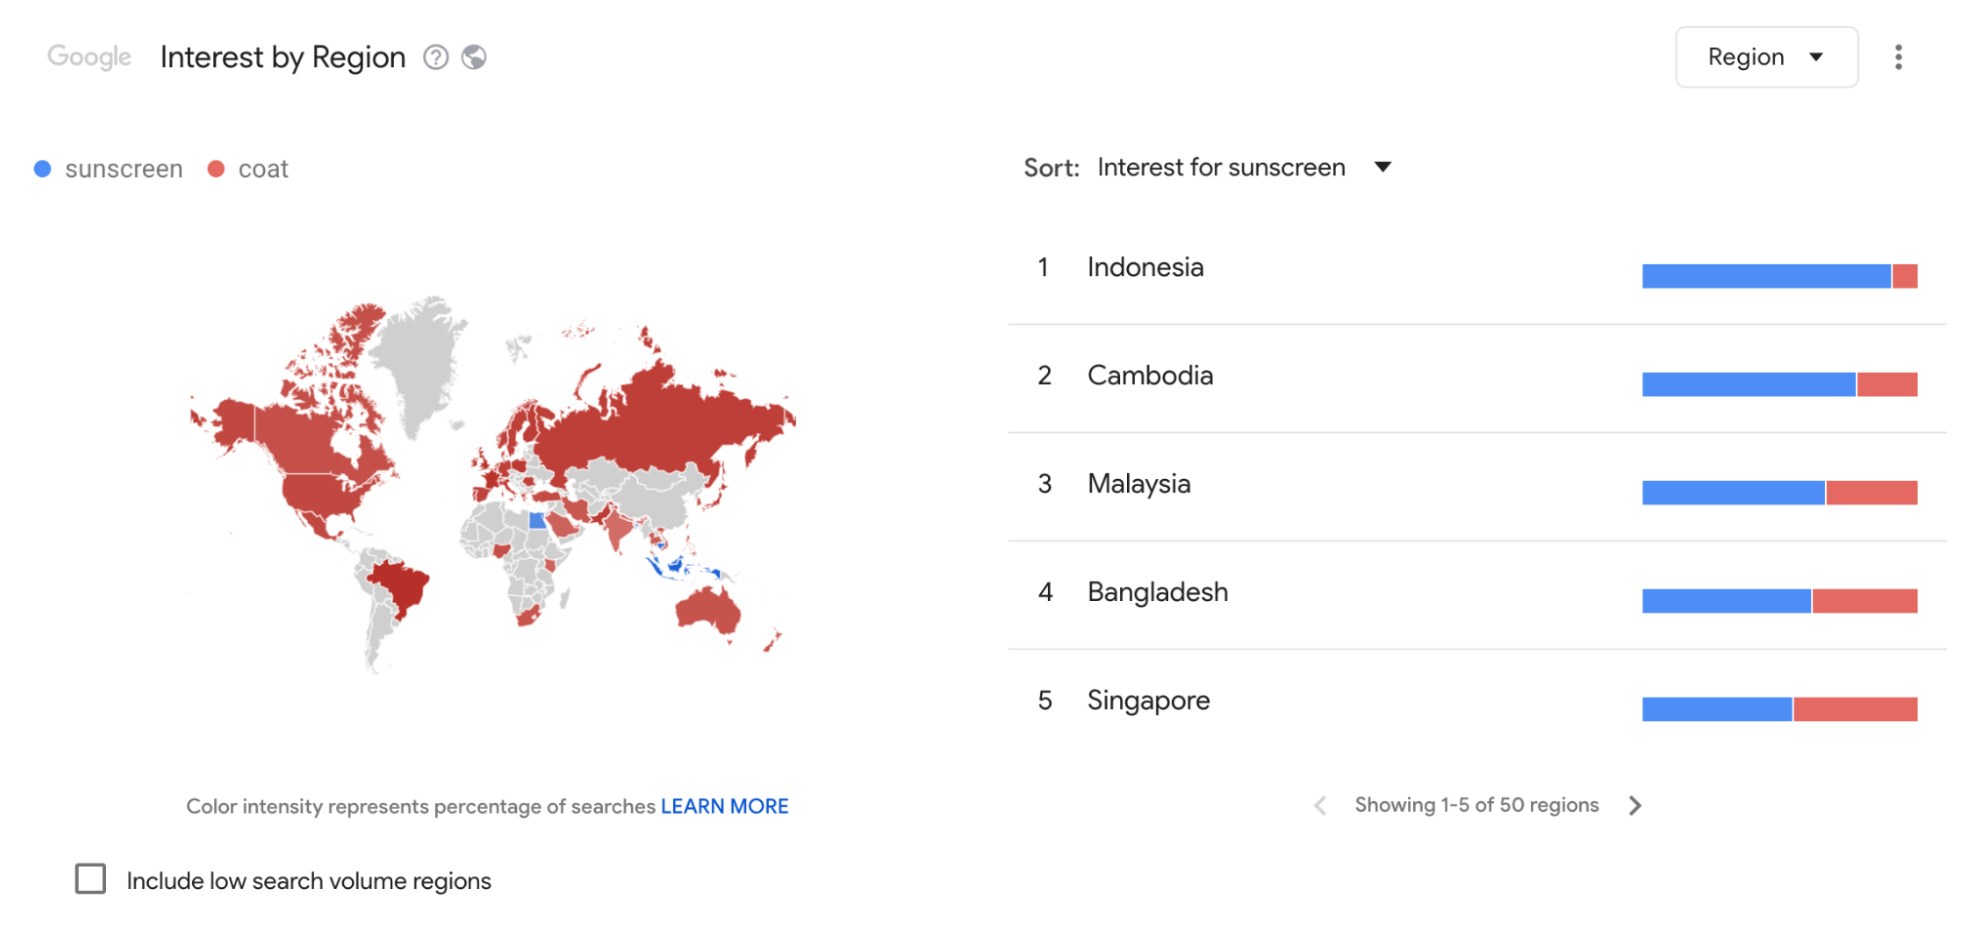
In the case of sunscreen vs. coats, Indonesia ranks the highest, with searches for sunscreen making up the majority of the two terms’ combined search volume. Conversely, Egypt shows a majority interest in coats. If needed, you can view the exact breakdowns by hovering over the blue and red bars.
Lastly, when examining the map, it's clear that coats dominate most regions, with only Indonesia and a few other Asian countries showing a preference for sunscreen.
This data can help provide a better understanding of global or regional preferences across topics.
Related Topics and Queries
At the bottom of the page are the Related Topics and Related Queries sections.
Related Topics shows which topics users searching for the primary term also searched for and can be sorted in two ways:
“Rising” shows related topics with the biggest increase in search frequency since the last time period. Results marked "Breakout" had a tremendous increase, likely because these topics are new and had few (if any) prior searches at the beginning of the specified period.
“Top” shows the most popular related topics, with scoring again on a relative scale (0-100).
Related Queries is similar to Related Topics except it mostly highlights queries that actually include your search term. For example, while Related Topics might return topics like “skin” or "moisturizer", Related Queries will return results like "Neutrogena" or “mineral sunscreen.”
You can use this for insight into what people commonly search alongside a topic, including brands, rather than for ideas on tangential topics to investigate.
Categories and Search types
The last two features are near the top of the page, next to the Location and Time Range dropdowns: Category and Search type.

Since some words have multiple meanings, the Categories dropdown allows you to see the interest in your primary topic when classified as a particular category by Google.
For example, “jaguar” is both an animal and a car brand. Google attempts to classify searches by category to allow Trends users to select which one they mean in these cases. In this case, that means that if you wanted to see searches for “jaguar” that Google categorized as for the car, you'd select the “Autos & Vehicles” category, and vice versa.
In most cases, this feature is not necessary and only results in limiting your available data due to imperfect categorization, but it’s there if needed.
Learn more about categorization in Google Trends.
Lastly, the Search Type dropdown lists different types of Google searches, featuring Web (default), Image, News, Shopping, and YouTube. These are discreet datasets that do not overlap.
This feature is useful if you're interested in non-Web searches for a keyword.
Advantages of using Google Trends
There are many advantages to using this unique dataset, including but not limited to:
Real-time data: Google Trends provides up-to-the-minute data, allowing users to react quickly to emerging trends before they appear in other tools.
Digital truth serum: Data from Google Trends captures genuine user interests and concerns that are not typically shared in surveys or other research. Many consumers say they’re more honest with Google search than with their own spouse.
Extensive historical analysis: Access to over two decades of data allows for long-term trend analysis.
Customizable queries: Users can explore any keyword they're interested in, not only select terms that are pre-curated, as is often the case with other trend analysis tools like Pinterest, Yelp, or TikTok Trends.
Unrestricted queries: While Google Ads prohibits certain subjects like cryptocurrencies, alcohol, and medicine, Trends provides unrestricted access to all keywords. Unfortunately, many trend analysis tools only rely on Google’s Adwords API to gather search data, therefore providing limited insights.
Massive scale of data: Google processes trillions of searches annually, making the dataset extremely large and diverse. This also means there’s less bias towards a single demographic, so a given analysis is far less likely to be skewed.
For these reasons and more, Google Trends is a powerful tool to analyze Google search data across a broad range of roles and tasks.
Continue on to the next article in this Google Trends mega-guide to learn more about what sets this tool apart, as well as some limitations to be aware of.